Ditch the vanity metrics for these actionable metrics


Scaling a business depends on more than just tracking numbers in monthly dashboards. You have to be tracking metrics that actually mean something — i.e. drive better decision-making and product improvements.
Vanity metrics like website traffic and social media followers provide great high-level indicators of how your business is doing, they don’t often uncover actionable insights into how to help your business grow. Digging into some meatier metrics that can have a direct influence on decisions that supercharge your customer acquisition, retention, and overall business performance is a much more valuable practice.
Vanity metrics - provide a high-level temperature check of your business.
Actionable metrics - Point to strategies that impact business performance.
Core SaaS metrics
Ultimately as a SaaS company, on the finance side of everything, you want to minimize the cost required to get new customers, maximize their spend with you, and keep them as a customer longer. The following core metrics cut directly to these goals to help you identify areas for improvement and areas where you’re seeing successful outcomes.
Customer Acquisition Cost (CAC)
Your customer acquisition cost, or CAC, is the amount of money, on average, needed to secure new customers. This takes into account all marketing and sales expenses incurred. You do not take into account operational expenses, though.
To calculate CAC, you simply divide your total sales and marketing spend over a certain period by the total number of new customers you acquired during the same period.
Interpreting CAC
While the “ideal” customer acquisition cost can vary greatly depending on the cost of the product — i.e. A CAC of $7,000 could be great for a $100,000 product but not for a $10,000 product — a general rule of thumb is to aim for a 3.1:1 ratio when comparing your CAC to your LTV (which we’re touching on next). In short, this means that you want to get about 3X the value that you paid for a customer throughout the lifeline of your relationship with them.
A high CAC could suggest inefficiencies or targeting errors in your marketing channels, whereas an extremely low CAC combined with high customer retention may point to scalable growth opportunities.
If you’re experiencing consistently high customer acquisition costs, you may try:
- Optimizing marketing funnels for higher conversion.
- Leveraging organic channels such as SEO or referrals.
- Targeting higher-value customers to balance CAC with higher LTV.
Lifetime Value (LTV)
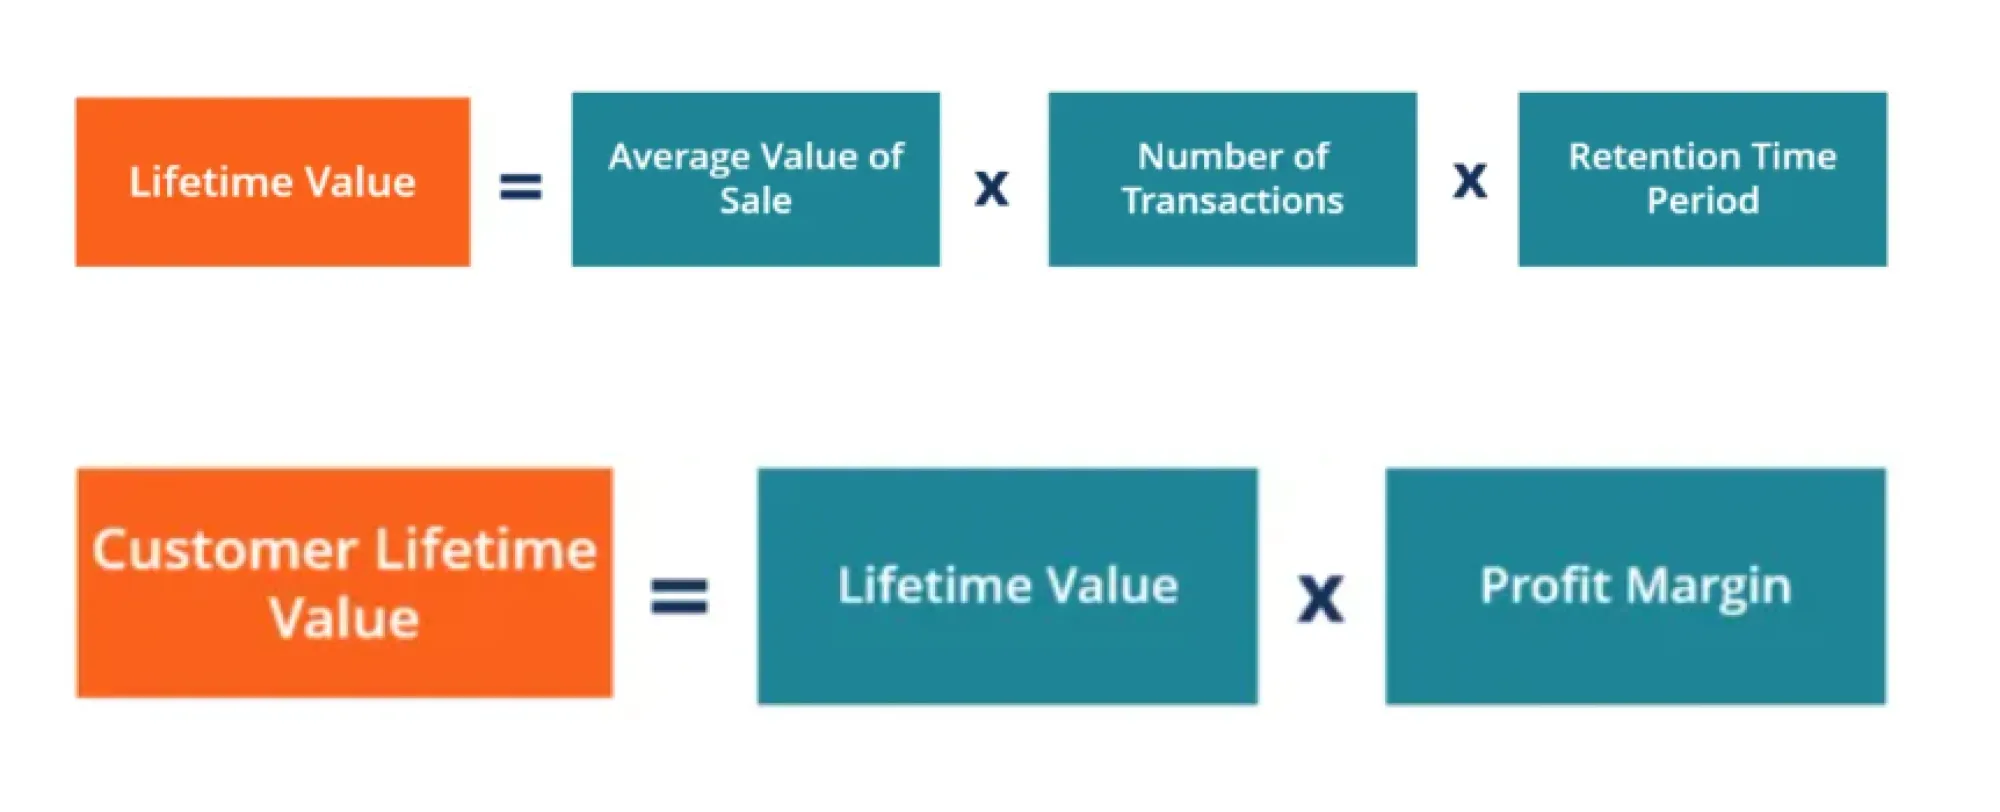
Lifetime Value, or LTV, is the metric that helps to balance your customer acquisition cost. This represents the total revenue that a customer will generate for your business over their entire relationship with you.
To calculate customer lifetime value, you multiply the average value of sale by the number of transactions by the retention time period. Then, you multiply that by your profit margin.
Interpreting LTV
When your LTV is higher than your CAC, the business is healthy, and the wider the gap between them, the better. This sheds more light on the discussion we started earlier in the CAC section. If your lifetime value is really strong, let’s say $5,000, it may make sense for you to have a CAC of $1000 for a $500 product, since you consistently see multiple repeat purchases.
Tracking your LTV in the short and long term can help you make better decisions about increasing pricing, insight into upselling/cross-selling strategies, and improvements to your customer engagement initiatives. Reducing churn rates also boosts your LTV, as we’ll talk about next (this is why we call them core metrics, because they’re all so interconnected, as you can see!)
Some strategies to improve customer lifetime value are:
- Enhancing customer experience and support.
- Providing value-add features that drive continued usage.
- Implementing loyalty programs to reduce churn.
Churn Rate/Retention Rate
Churn rate is the percentage of customers who stop using the service within a given period.
There are two different ways you can calculate churn: Customer churn or revenue churn. While customer churn focuses on the number of customers who leave in a given period, revenue churn focuses on the associated revenue you lose as a result of customers leaving. Both have their value, but they communicate different things. Customer churn is an indicator of how well you can retain customers, while revenue churn is an indicator of how well you can retain value. So it’s completely possible to have a high customer churn rate without it being a red flag, so long as the customers you’re retaining are all of the most high-value customers.
You calculate the customer churn rate by dividing the total number of customers lost by the total number of customers at the start of the period. For revenue churn, you divide the total revenue lost by the total revenue at the start of the period.
Graphic: show these calculations
Customer churn = Number of Customers Lost ÷ Total Number of Customers at the Start of the Period.
Revenue churn = Amount of Revenue Lost ÷ Total Revenue at the Start of the Period.
Retention rate is the flip side of this metric and tracks how many customers stay and continue to purchase over time.
Graphic:
Retention rate = (Number of customers at the end of the period - number of new customers)/Number of customers at the start of the period.
Interpreting churn and retention rates
High churn can indicate product dissatisfaction, poor user experience, or a lack of support. When you’re intentional about gathering feedback and tracing churn back to engagement metrics, this provides a really reliable look into experiences and actions that are most likely to lead to churn, helping you be proactive about mitigating these problems.
To maximize retention and minimize churn, you can implement:
- Active customer support and engagement initiatives.
- Regular product updates and feature releases based on user feedback.
Monthly Recurring Revenue (MRR) and Annual Recurring Revenue (ARR)
Reliable income is the lifeblood of any successful business, so tracking your recurring revenue on both a monthly and annual basis are key to keeping tabs on the health of your organization. Monthly Recurring Revenue (MRR) is the consistent revenue that you earn from subscriptions on a monthly basis, while Annual Recurring Revenue (ARR) reflects the same, but just on an annual basis.
The calculation here is really simple. You simply calculate the sum of all subscription contracts over the course of either a month or a year, depending on which metric you’re trying to calculate, and exclude any one-time or non-recurring fees.
Interpreting MRR and ARR
Both of these recurring revenue metrics are key indicators of financial stability and growth. Due to the heavy reliance of SaaS businesses on subscription models, this is one of the most valuable and actionable metrics to track.
When you notice fluctuations in your recurring revenue, it may spur actions like revising your pricing models, launching new subscription tiers to target either a high-end or budget audience, or expanding into new markets. While we mentioned before that vanity metrics provide not quite as meaningful of a high-level view, ARR and MRR are perhaps the most valuable high-level views you can take.
Some recurring revenue expansion tactics include:
- Upselling premium features or higher tiers of service.
- Offering personalized pricing or discounts for annual subscriptions.
User sentiment as an actionable metric
If you’re a veteran in the Saas space (or even just a well-researched newbie), there’s probably little that we just talked about that’s completely new to you. Up until now, we’ve been talking about actionable metrics that are table stakes to running and monitoring a successful SaaS company.
So now, we’re going to hit you with something perhaps a little more niche. Let’s shift our focus away from the numerical performance indicators and towards a more qualitative approach.
User sentiment, while not quite as easy to track cleanly on your typical dashboard with charts and numbers, is an often overlooked goldmine for actionable insight. Capturing sentiment and analyzing it in a reliable way, often using AI and Machine Learning models, can provide crucial insights into product usability and customer satisfaction.
Some sources you can pull user sentiment from are:
- Conversation records from live chat (both with real people and conversational AI tools)
- Surveys sent from within the product and to their emails
- Social media mentions and online reviews
The problem with this: data is often siloed
A core challenge in making sentiment data actionable is ensuring that it flows seamlessly between teams. Traditionally, support teams handle user feedback, while marketing and product teams may rely on quantitative data alone. This separation can create blind spots in decision-making.
To break down silos between support, product, and GTM teams, there are several strategies that you can enact:
- Create cross-departmental alignment by setting regular reviews of sentiment data involving product and marketing teams.
- Integrate various data streams, including sentiment data, into a single source of truth so that you don’t have to worry about different teams having access to different data.
- Use collaborative dashboards that allow different teams (product, marketing, sales, customer support) to view and contribute to shared metrics.
- Leverage AI-powered sentiment analysis tools that can automatically categorize user feedback into themes for deeper understanding.
When you take a more cross-departmental approach to sentiment data, you can use aggregated feedback to prioritize bug fixes and feature development, as well as fine-time your marketing messages to address pain points identified directly in customer conversations.
Predictive analytics and proactive action
This last actionable metric isn’t a single metric but rather an emerging category of metrics as we begin to experience an increasingly AI-driven world.
Many companies are now beginning to leverage predictive analytics for more proactive (rather than, historically, reactive) decision-making. This can help companies go beyond analyzing historical data and instead attempt to forecast future trends like customer churn or usage patterns. Predictive models can help to highlight at-risk customers or suggest ideal times for upselling based on behavioral data, for example.
A new era calls for new metrics
There are some metrics, like the core metrics we mentioned at the beginning of this piece, that are likely to be around for a while. But that doesn’t mean that your monthly, quarterly, or yearly dashboards should continue to look exactly the same.
As technology, customers, and the world around us continues to change, it’s important to stay on top of any new metrics that may be emerging. For now, we see user sentiment and predictive analytics as the intriguing new kids in town, but who knows what may come next? That’s what makes this space so exciting.