Product marketing KPIs can save you from flying blind
Uncover the power of product marketing KPIs. Learn how to measure success across the customer journey, from brand awareness to user retention to optimize your product marketing efforts and achieve long-term product success.


We don't know about the rest of his sayings, but one thing that Lewis Caroll got right was, "If you don't know where you are going any road will get you there."
Product marketing isn't immune to this either. Launching campaigns without KPIs is like throwing messages and marketing tactics into the void, hoping something will stick. Without the right KPIs, you’ll end up in a Wonderland of your own making – never quite sure whether you are actually winning customers or undertaking an unsuccessful trip down a useless rabbit hole.
Three reasons why you absolutely need product marketing KPIs
Here’s the deal with key performance indicators in product marketing –
- Know what’s working and what’s a complete flop. You can see exactly where your marketing efforts are paying off and where you're wasting resources. This lets you double down on the good stuff and ditch the tactics that are going nowhere.
- Get users to actually use your product. KPIs aren't just about clicks or visits. They give you insights into how people are interacting with your product. This helps you identify any roadblocks, especially within the product experience, and make sure users are getting the most out of what you offer.
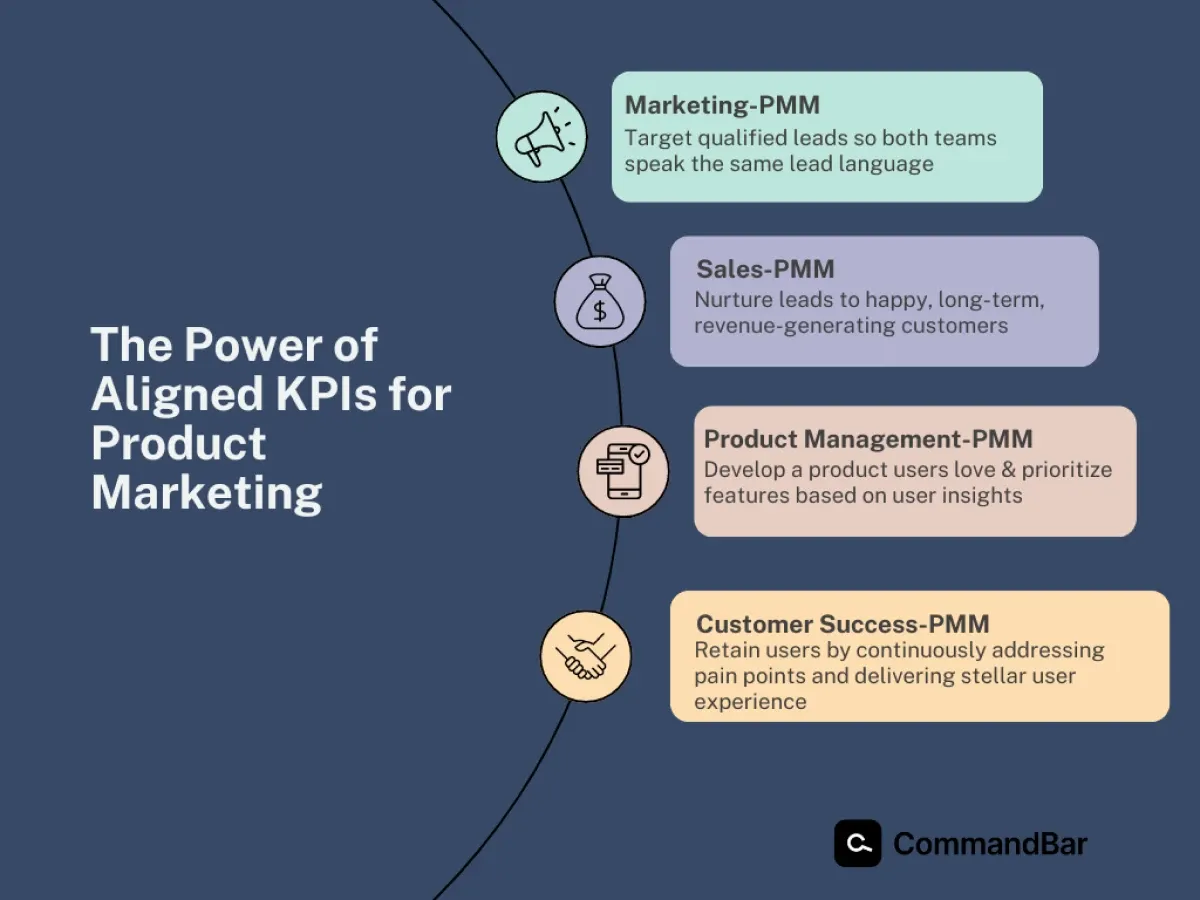
- Align with the big picture: Product marketing shouldn't exist in a silo. KPIs ensure your efforts directly contribute to the business’s overall goals. With KPIs, everyone's on the same page, working towards the same measures of success.
Setting KPIs for every stage in the customer journey
How do you know if your customers are moving in the right direction, at the right speed, at the right time, and in the right mood? Each stage in the customer journey presents a unique opportunity to measure product marketing success from different perspectives. Let’s delve into the relevant KPIs for each.
Awareness stage KPIs
- Website traffic and engagement metrics are your window into how users interact with your product's online presence. We're talking total visitors, unique visitors, page views, bounce rate, and time spent on the site. These reveal how effectively you're attracting potential customers and keeping them engaged.
- Tracking brand awareness and perception involves gauging customer sentiment towards your brand and product. These can be measured through social media mentions, brand search volume, and brand recall surveys.
Acquisition stage KPIs
- This stage focuses on converting browsers into believers. Here are some KPIs that help you measure this – the number of leads generated, landing page conversion rate, and form completion rates for gated content. By leveraging gated content on WordPress, you can effectively capture leads and track conversions, providing valuable insights into user engagement and interest.
- Another important metric to track is cost per lead (CPL). It is the average amount you spend to acquire a single lead. Analyzing your CPL across different marketing channels helps you identify the most efficient ways to reach your target audience. It helps you decide whether you are getting the most bang for your buck.
Activation stage KPIs
- Signups and completion rates give you valuable insights into user interest and their initial experience with the product. A low signup rate might be a sign that your free trial offer needs tweaking or there are roadblocks preventing users from signing up.
- Another KPI to keep track of is time to value (TTV). It measures how quickly new users grasp the value of your product, experiencing the “aha moment” and achieving their desired outcomes. A high TTV indicates a potential roadblock – maybe your onboarding process is confusing, or the product itself isn't friendly enough for self-service onboarding.
Adoption stage KPIs
- Feature adoption rates track how often users interact with specific features within your product. By analyzing this metric, you can identify what is resonating with your user base and which features might need more attention from your product management guys.
- Another adoption metric to keep your sights on is daily/monthly active users (DAU/MAU). It shows how many users are actively engaging with your product on a daily or monthly basis. For instance, For B2B SaaS companies, Mixpanel's benchmark suggests a typical daily to monthly active user (DAU/MAU) ratio of around 13%. Such data could indicate that B2B users might not need your product every single day, but they find value in it enough to keep their subscription active – a sign of successful product adoption.
Retention stage KPIs
- The customer churn rate reflects the percentage of users who abandon ship within a certain timeframe. A high churn rate is a red flag that needs investigation to understand why users are leaving and what you can do to improve their experience and keep them engaged.
- Net promoter score (NPS) and customer satisfaction (CSAT) surveys directly ask users about their satisfaction with your product and the likelihood of them recommending it to others. This feedback is invaluable for understanding user sentiment.
- Not all user feedback comes in the form of overt numbers. In-depth surveys and analyzing conversations with customer experience can reveal a treasure trove of insights. We're talking about user frustrations, hidden needs, and overall product sentiment. By listening closely to what users have to say, you can identify areas for improvement and ensure your product continues to delight and retain the user base.
Go beyond the numbers
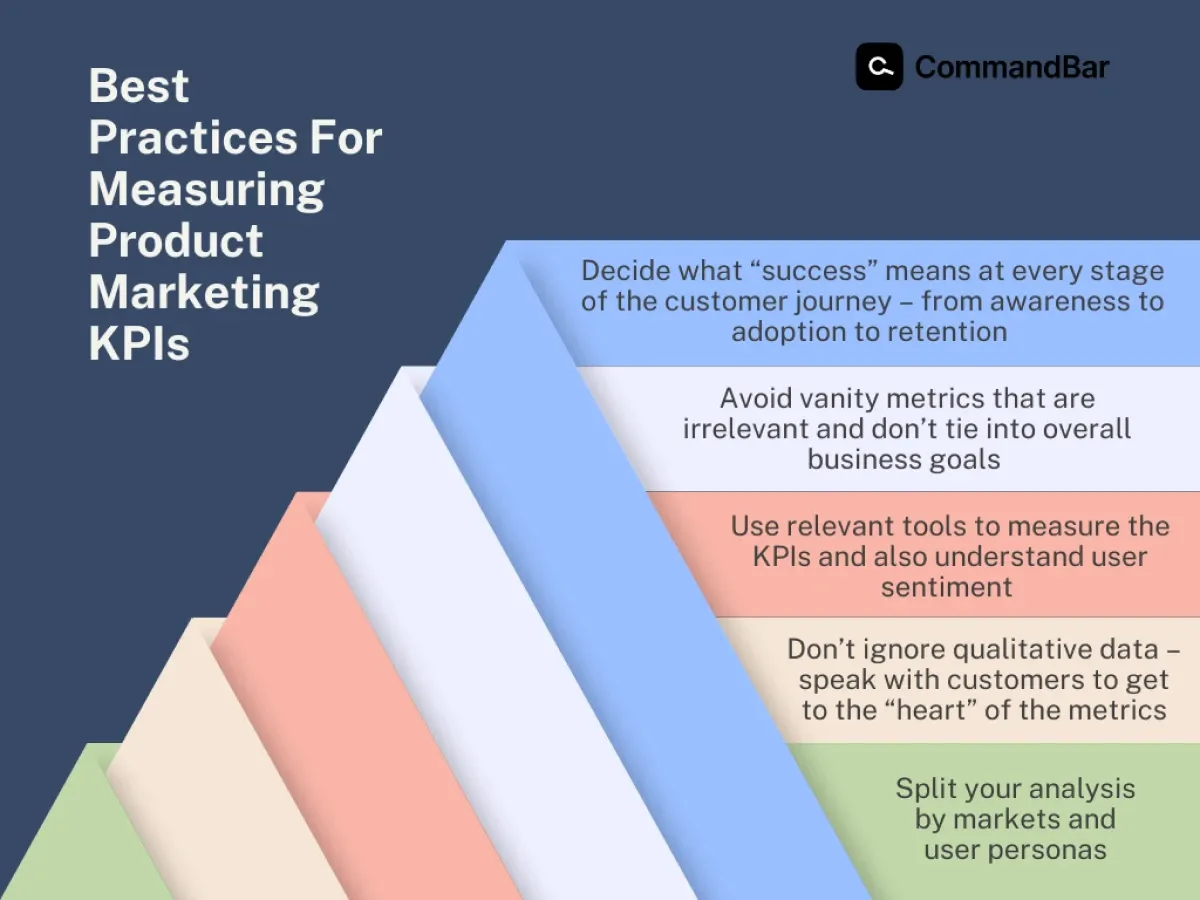
While KPIs provide a vital quantitative perspective, a truly comprehensive understanding of your product's success requires delving deeper into the user experience (UX). Here are some important things to remember when collecting data for all those KPIs.
Pop-up fatigue is real
You may be guilty of bombarding users with popups, notifications, and marketing messages across various challenges, especially within your platform. This can lead to popup fatigue, where users become desensitized or even annoyed by these interruptions. The overuse of popups can negatively impact the user experience and ultimately hinder product adoption.
Measure in-product popup engagement as a counter-metric
To gauge user receptiveness, you need to monitor in-product popup engagement. This will help you measure how users interact with your popups, such as clicking on a call to action (CTA) or closing the popup immediately.
A significant drop in engagement indicates that your popups are likely being ignored or causing frustration. This is a signal to re-evaluate your popup strategy and ensure they are delivering value to users rather than obstructing their experience.
Use tools like Command AI's strike dashboard to stay safe
You can use a tool like Command AI and its strikes dashboard to measure user annoyance with pop-ups. It allows you to control the frequency with which users see popups, preventing an overwhelming experience. If a user consistently dismisses popups, the dashboard can prevent further displays for a designated period, allowing them a frustration-free interaction.
The importance of continuous measurement and improvement with product marketing KPIs
If you don’t understand your customers and user behavior, your SaaS product, with all its bells and whistles will get you nowhere, or perhaps get you somewhere you don’t even wish to go. Success hinges on understanding how your product marketing is guiding your efforts and monitoring and analyzing the product marketing KPIs for each customer journey.
But KPIs are just the tip of the iceberg. User surveys and chat conversations can help unlock a treasure trove of information regarding user sentiment. By truly understanding their experience – from their frustrations to their desires you can make your product truly irresistible.